 Before You Start:
This lab puts material learned in Lectures 8 & 9 into action. It is introducing you to the analysis of deep multi-temporal SAR image data stacks and demonstrates the utility and information content of SAR time series stacks. Like the previous lab, this exercise is done in the framework of Jupyter Notebooks and take advantage of its benefits such as pre-installed software tools, sufficient compute power, and interactive mix of lab instructions and computer code.
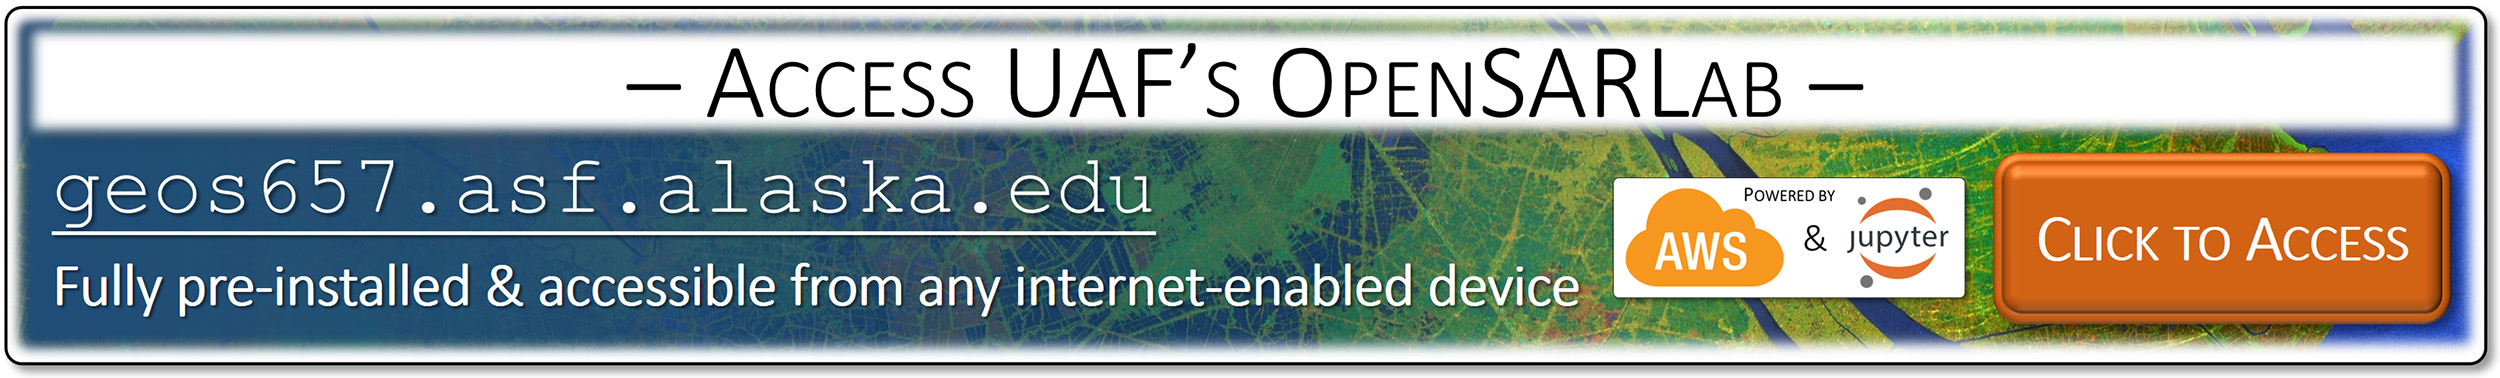
All the data processing in this lab will be done within UAF’s cloud-based OpenSARLab, which is accessible to you at geos657.asf.alaska.edu. The lab is implemented within the Amazon Web Services (AWS) cloud and is accessible to you from any device with internet connection and a web browser.
Goals of this Lab:
This lab provides exposure to the analysis of deep SAR image data stacks within a Jupyter Notebook framework. It introduces you to the following data analysis concepts:
-
- How to load time series stacks into Jupyter Notebooks and how to explore image content using basic functions such as mean value calculation and histogram analysis.
- How to subset images create time series information of calibrated SAR amplitude values.
- How to explore the time-series information in SAR data stacks for environmental analysis.
- Relationship of radar brightness with variables such as vegetation cover and soil moisture.
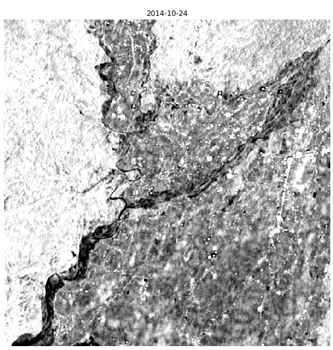
 The lab will be using a 70-image deep C-band SAR data stack over Nepal for a first experience with time series processing. The L-band data were acquired by the Sentinel-1 SAR sensor constellation and are available to us through the services of the Alaska Satellite Facility.
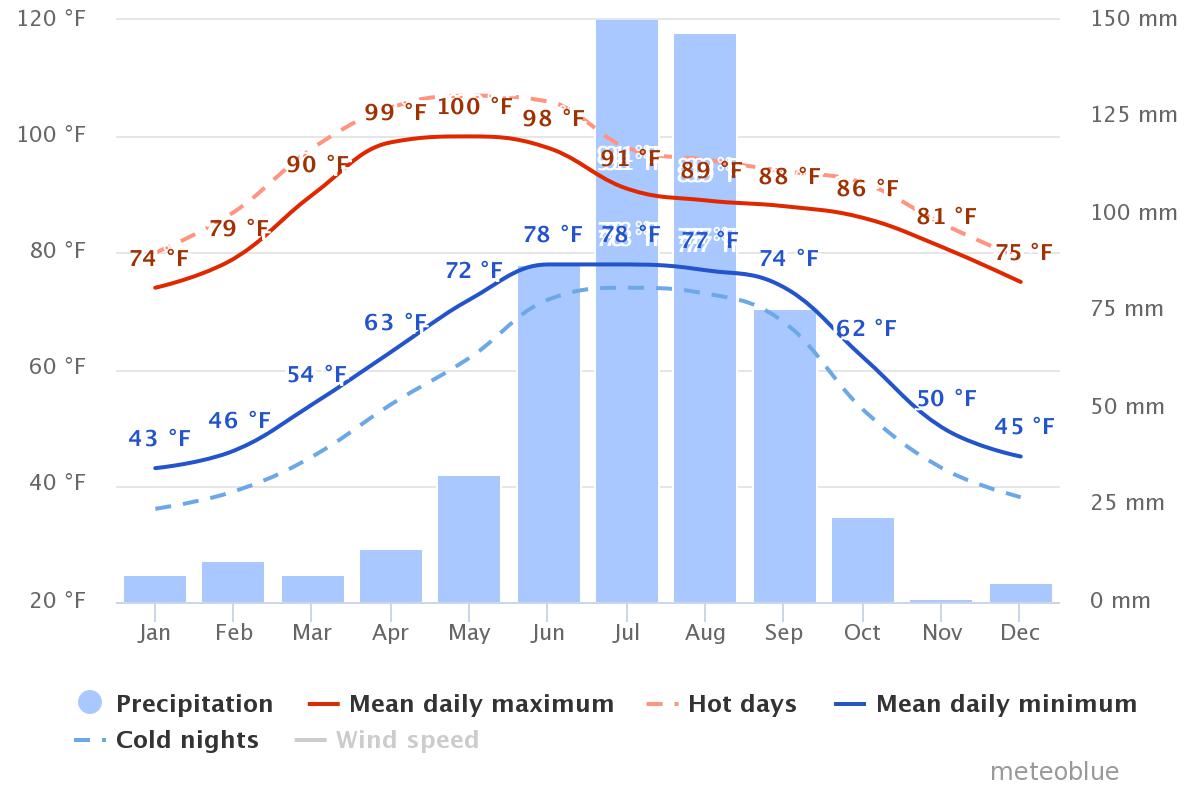
Nepal is an interesting site for this lab due to the significant seasonality of precipitation that is characteristic for this region. Nepal is said to have five seasons: spring, summer, monsoon, autumn and winter. Precipitation is low in the winter (November – March) and peaks dramatically in the summer, with top rain rates in July, August, and September (see figure to the right). As SAR is sensitive to changes in soil moisture, these weather patterns have a noticeable impact on the Radar Cross Section (γ0) time series information.
We will analyze the variation of γ0values over time and will interpret them in the context of rainfall rates in the imaged area.
 Completing the Lab and Homework Assignment:
To access and complete the OpenSARLab exercise, please follow these steps:
- Access the OpenSARLab at geos657.asf.alaska.edu.
- Log in with your username and password (contact me should you need login credentials).
- Navigate to the notebooks / ASF / GEOS_657_Labs / 2023 / folder.
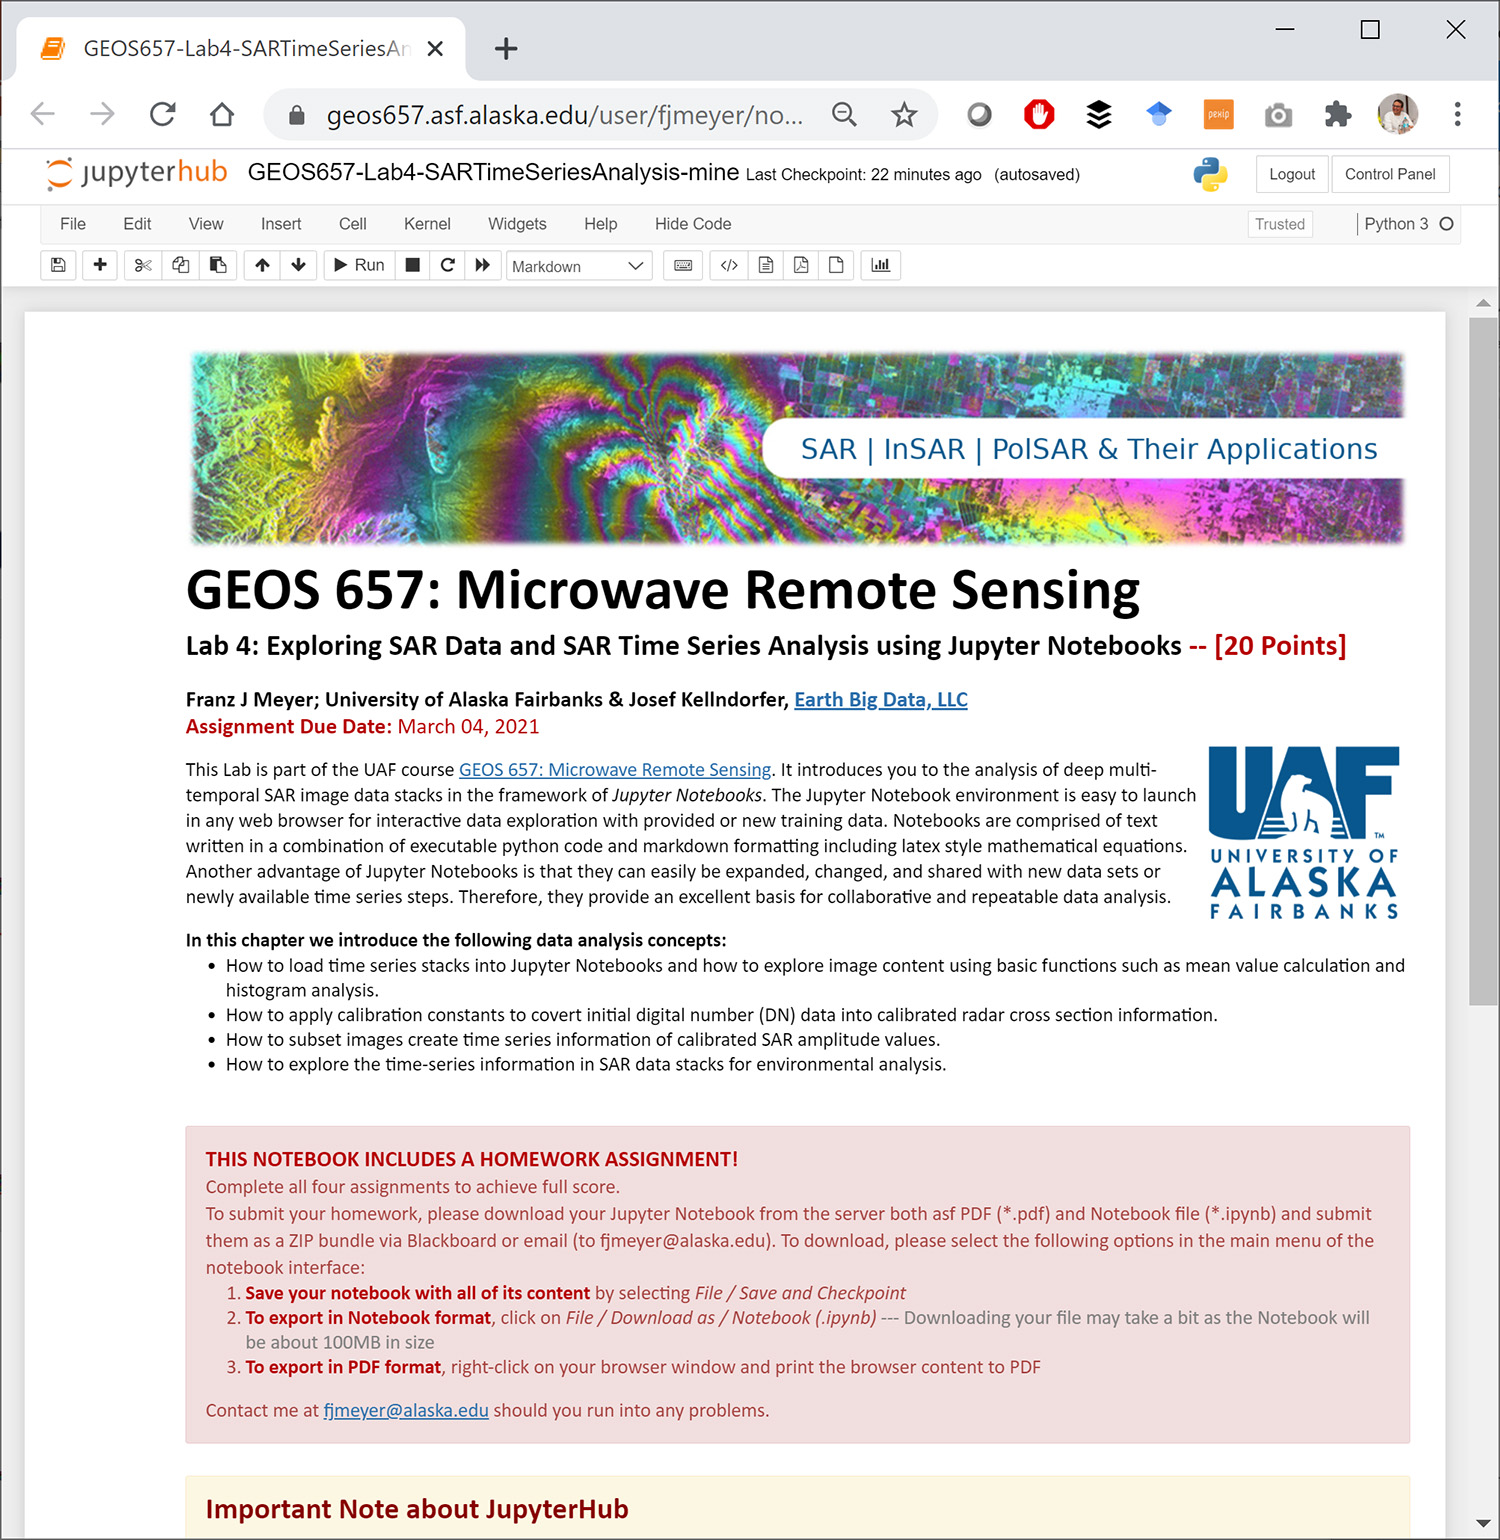
- Start the Juypter Notebook (GEOS657-Lab4-SARTimeSeriesAnalysis.ipynb). A screenshot of the Notebook opened in your Jupyter console is shown to the right.
- Complete the notebook and the lab assignments within.
- Submit your assignments as instructed in the notebook.
Watch the 2023 Recording of this Lab:
A recording of the 2021 run of this lab is available here.
The University of Alaska Fairbanks is an AA/EO employer and educational institution and prohibits illegal discrimination against any individual: Learn more about UA’s notice of nondiscrimination.